Executive summary
- Two rent cycles. In the median of the 30 largest MSAs, multifamily rents are up 35.0% since Jan 2015 (2.6% a year) and single-family up 27.5% (2.1% a year). The gap was zero in Jan 2021, peaked at 8.3 points in Aug 2022 and is 7.5 points now.
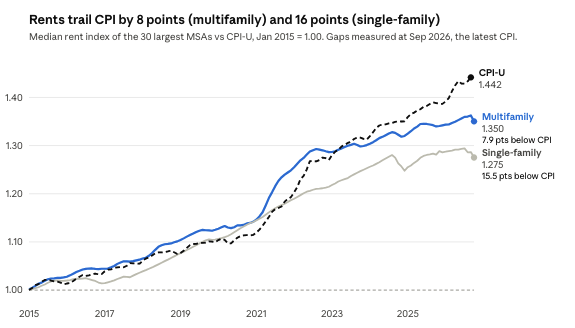
- Versus inflation. CPI is up 44.2% since Jan 2015 (3.2% a year, to Sep 2026). Multifamily trails it by 7.9 points and single-family by 15.5 points. Multifamily ran ahead of CPI in 95 of 141 months and has been behind since Mar 2023.
- Last 12 months. Multifamily rents are up in 27 of 30 MSAs (median +1.1%). Single-family rents are up in only 7 of 30 (median -1.1%). CPI is up 3.7%.
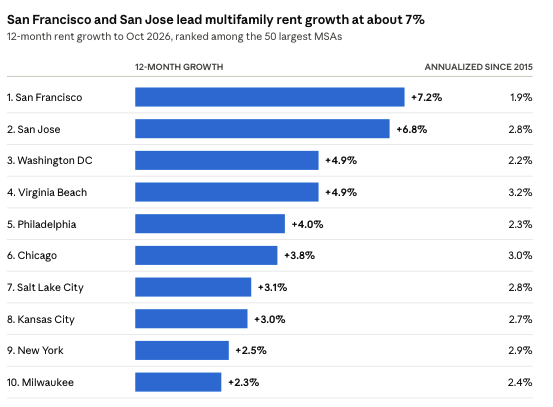
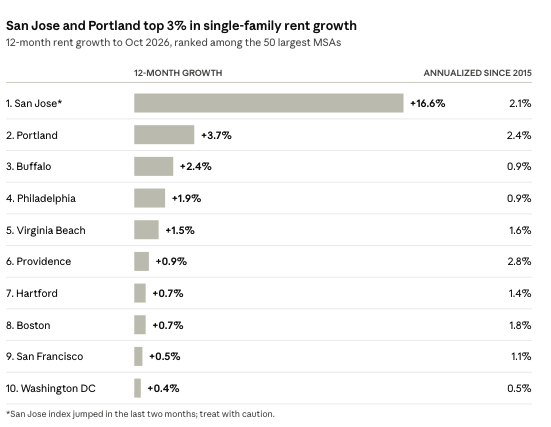
- Leaders. Multifamily: San Francisco +7.2%, San Jose +6.8%, Washington DC +4.9%. Single-family: Portland +3.7%, Buffalo +2.4%, Philadelphia +1.9% (San Jose’s +16.6% looks like data noise).
- Watch. The multifamily median index dipped 0.9% in October, which may be revised. Sunbelt single-family is weakest, with Miami at -3.9% and San Antonio at -3.7%.
Between 2015 and 2020, apartment and single-family rents in America’s largest metros moved almost in lockstep. Since 2021 they have not. In the median of the 30 most populous metros (MSAs), multifamily rents are up 35.0% since January 2015, against 27.5% for single-family.
The figures come from monthly rent indices through October 2026, with January 2015 set to 1.00.
The decoupling
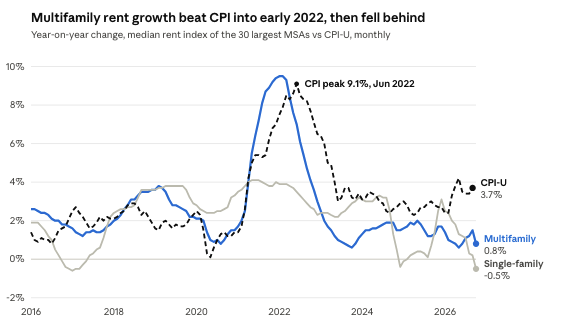
Through 2020 the gap between the two medians stayed under four points, and it closed to zero in January 2021. Then multifamily surged: year-on-year growth in its median index reached 9.5% in January 2022, more than double the 3.9% for single-family. The gap peaked at 8.3 points in August 2022. It stands at 7.5 points today. That is 2.6% a year for multifamily against 2.1% for single-family since 2015.
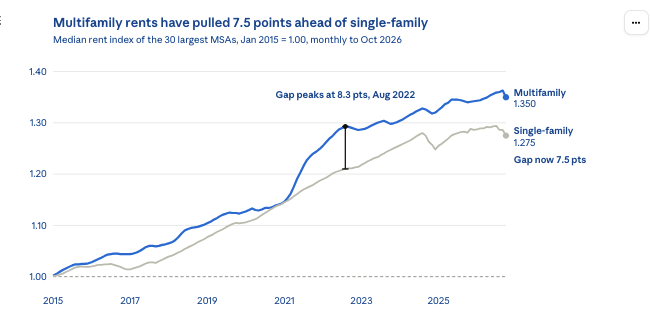
Single-family rents kept rising through mid-2024, but never closed the gap, and the two cycles now point in different directions.
Rents versus inflation
Rents have not run away from inflation, but they have lagged it. Through September 2026, CPI is up 44.2% since January 2015, or 3.2% a year. Multifamily rents are up 36.3% (2.7% a year) and single-family rents 28.6% (2.2% a year). Multifamily was ahead of CPI in 95 of 141 months and slipped below it in March 2023 as inflation caught up. The shortfall is 7.9 points today and has not exceeded 8.1 points in either direction. Single-family has trailed CPI since October 2021 and is 15.5 points behind.
The recent picture is wider. CPI inflation is 3.7% year on year, lifted by gasoline, while the median multifamily index is up 0.8% and single-family is down 0.5%. Multifamily rent growth beat CPI through early 2022, fell behind in mid-2022 and has mostly stayed behind.
Multifamily: slow but still rising
The recent multifamily trend is modest growth. The median index set a record in September 2026, and 27 of the 30 largest MSAs have higher apartment rents than a year ago. The median MSA gain is 1.1%. Momentum has been uneven: year-on-year growth in the median index slowed from 1.7% in December 2025 to 0.6% in May 2026, recovered to 1.5% in September, then eased to 0.8% in the latest month, which may be revised.
Single-family: down but not out
Single-family has turned. The median index peaked in July 2026 and is 1.5% below that level now. Only 7 of the 30 MSAs show higher rents than a year ago, and the median MSA is down 1.1%.
The big metros
San Francisco leads the large metros for apartments at +7.2% year on year, yet its annualized rate since 2015 is only 1.9%, so this looks more like recovery than boom. Chicago (+3.8%) and New York (+2.5%) are steadier, with long-run rates near 3% a year. Minneapolis (+1.8%) and Atlanta (+1.5%) are modest.
Dallas (+1.1%), Los Angeles (+0.4%) and Houston (+0.4%) are close to flat, and Houston is the weakest long-run performer at 0.9% a year.
Single-family tells a different story. Rents are down year on year in Houston (1.9%), Los Angeles (1.8%), Dallas (1.7%), Atlanta (0.9%), Chicago (0.5%), Minneapolis (0.4%) and New York (0.1%).
San Francisco is the exception at +0.5%. Atlanta (1.41 against 1.39), Las Vegas and Portland are the only large metros where the single-family index sits above multifamily, so the decoupling is not universal.
What to watch
Watch whether the October pullback in multifamily holds. If it does, the gap with single-family narrows from the top rather than because home purchase activity recovers.
Sunbelt single-family looks weakest, with Miami down 3.9%, San Antonio down 3.7% and Phoenix down 2.5% year on year. These are MSA-level medians, so submarket and asset-level rents can differ widely from them.
For further research queries email hello@beekin.co with subject line: Indices and we look forward to digging in further