Indiana and 5 Cities
Multifamily operators in secondary cities face several financing challenges compared to their counterparts in primary markets. Some key pain areas
- Higher lending requirements – Lenders typically demand higher debt service coverage ratios, lower loan-to-value ratios, and more substantial reserves for properties in secondary markets.
- Limited lender options – Fewer regional and national lenders actively finance deals in secondary markets, resulting in less competition and potentially less favorable terms.
- Risk perception premiums – Capital providers often charge higher interest rates to compensate for the perceived additional risk of secondary markets.
- Market volatility sensitivity – Secondary markets can experience more dramatic swings in occupancy and rental rates during economic downturns.
- Economic base concerns – Lenders worry about markets dependent on a limited number of employers or industries.
Using data from Beekin same-store rental indices, we analyze secondary cities around the country and compare them to the primary MSAs in the state. This helps understand multifamily investment opportunities in these cities and the volatility inherent in these markets.
Indiana
In Indiana, secondary cities are typically understood as urban centers that are not as large or dominant as Indianapolis (the primary city and state capital) but still play important economic, cultural, or regional roles. Here’s a list of top secondary cities in Indiana, based on population, regional importance, and economic activity:
1. Fort Wayne
- Population: ~270,000 (second-largest in the state)
- Known for: Manufacturing, defense, healthcare, and tech
- Why it matters: Major regional hub in northeast Indiana, with a strong economy and growing downtown development.
2. Evansville
- Population: ~118,000
- Known for: Energy, manufacturing, and healthcare
- Why it matters: Key city in southwestern Indiana, near the tri-state area (Indiana, Illinois, Kentucky). Also has a regional airport and major medical centers.
3. South Bend
- Population: ~103,000
- Known for: University of Notre Dame, healthcare, and tech startups
- Why it matters: Anchors the South Bend–Mishawaka metro area and has been undergoing a tech-driven revitalization.
4. Bloomington
- Population: ~80,000
- Known for: Indiana University, research, and culture
- Why it matters: A classic college town with high educational attainment and a strong knowledge economy.
5. Lafayette–West Lafayette
- Population: ~72,000 (Lafayette), ~50,000 (West Lafayette)
- Known for: Purdue University, pharmaceuticals, and advanced manufacturing
- Why it matters: Purdue drives innovation and talent, making it a tech and research hub in western Indiana.
The same-store indices contain 10 year rent index values for several Indiana MSAs from January 2015 onward. The MSAs included in this analysis from the Beekin same-store rent indices for Jan 2015 to Jan 2025 are:
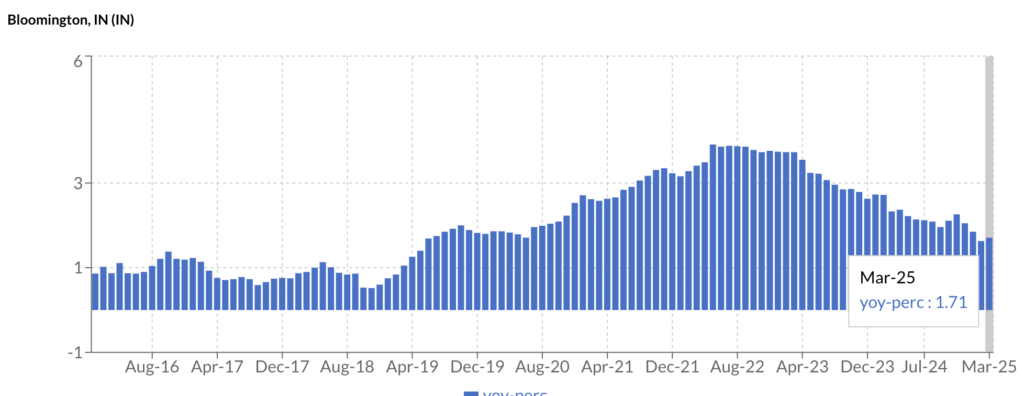
- Bloomington, IN
- Evansville, IN-KY
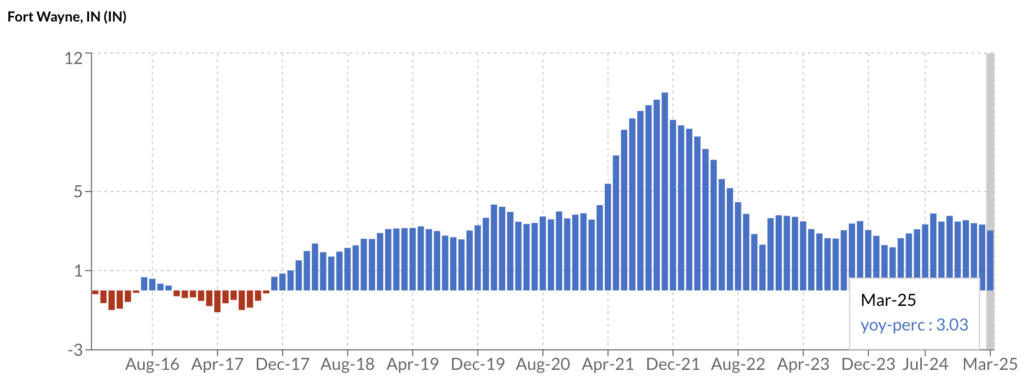
- Fort Wayne, IN
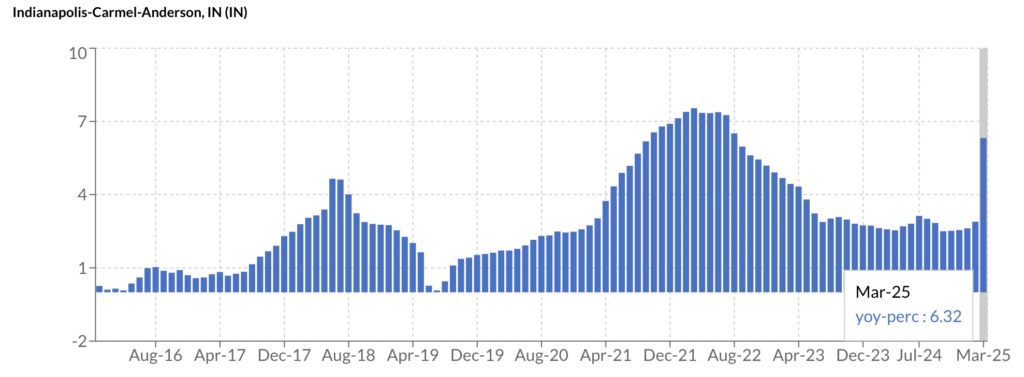
- Indianapolis-Carmel-Anderson, IN (used as the primary market benchmark)
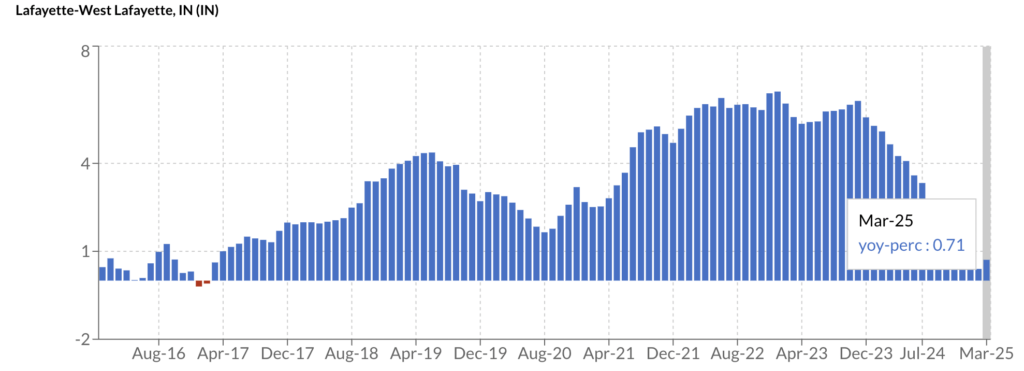
- Lafayette-West Lafayette, IN
- South Bend-Mishawaka, IN-MI
🏙️ Secondary Cities: A Second Look at Indiana
Multifamily operators in Indiana’s secondary cities face a unique landscape compared to the state’s primary metro, Indianapolis. While Indianapolis leads in size, population, and economic diversity, cities like Fort Wayne, South Bend, and Lafayette have posted competitive rent growth with varying levels of volatility.
Using data from Beekin same-store rental indices, we analyze key Indiana markets over the last decade to assess opportunities and stability in multifamily housing.
📊 10-Year Analysis – Indiana Secondary MSAs vs. Indianapolis
| MSA | % 10 Year Rent Change | Peak Rent Index | Peak Rent Period | Standard Deviation | Volatility Score | Max-Min Range |
| Indianapolis | 37% | 1.37 | Mar 2025 | 0.109 | 9.7% | 37.0% |
| South Bend | 36% | 1.38 | Sep 2024 | 0.113 | 9.6% | 38.0% |
| Fort Wayne | 33% | 1.34 | Jan 2025 | 0.120 | 10.7% | 35.4% |
| Lafayette | 33% | 1.34 | Dec 2024 | 0.117 | 10.4% | 35.4% |
| Bloomington | 21% | 1.21 | Oct 2024 | 0.070 | 6.5% | 21.0% |
| Evansville | 18% | 1.18 | Jan 2025 | 0.058 | 5.5% | 19.2% |
Volatility Score = Standard Deviation / Average Rent Index
 |  |
 |  |
🔍 Key Takeaways: Where Are Rents Most Dynamic?
1. Growth vs. Volatility
- Indianapolis led the state in absolute rent growth (37%) but wasn’t far ahead of South Bend (36%) or Fort Wayne and Lafayette (both 33%).
- Interestingly, South Bend had the highest peak rent index, slightly above even Indianapolis.
2. Fort Wayne and Lafayette
- These two college-anchored and manufacturing-strong metros showed identical rent growth and nearly matching volatility.
- Their relatively high volatility scores (10.7% and 10.4%) suggest more dynamic rent shifts than Indianapolis.
3. Bloomington and Evansville
- Bloomington’s rent growth (21%) and volatility (6.5%) were more muted—perhaps reflecting the seasonal or academic calendar effects of a college town.
- Evansville stood out for its lowest volatility (5.5%) and most gradual rent climb (18%), making it potentially more stable but slower-growing.
4. Market Stability
- Evansville and Bloomington offer stability over speed, with lower peaks and less dramatic shifts.
- Fort Wayne, Lafayette, and South Bend bring higher returns but come with higher price swings, indicative of evolving demand-supply dynamics.
📈 Final Thoughts
Secondary markets in Indiana may not match Indianapolis in scale, but they’ve shown impressive growth and, in some cases, even higher rent peaks. For multifamily investors and operators, the trade-off between rent growth and volatility is clear:
- South Bend and Fort Wayne might be appealing for those seeking appreciation with some tolerance for market swings.
- Evansville and Bloomington provide steadier, lower-risk environments.
- Lafayette, with the Purdue engine, presents a balanced case of volatility and upside.
See you in the next Market.