Beekin indexes, monitors and measures rent changes for over 14 million rental units across the US from 2015 till date. Using Big Data and AI we publish a rental index to measure changes in rent across the country. These are available as Recent Movers Index.
What is Beekin’s Recent Movers Index?
Beekin’s Recent Movers Index measures average change over time in the rental prices for new leases, available for multifamily (MF) apartments or single-family rental (SFR) homes, at a State or MSA level. The Recent Movers Index is built on a database of more than 14 million rental properties and covers all Contiguous US States and over 18,000 zip codes, 100 MSAs for MF and 70 MSAs for SFR.
Single-family rental and multifamily rental homes have different sources of rent data, and there are few quality-adjusted indices measuring price changes in rent. Beekin’s Recent Movers Index serves to fill that void by applying a repeat pairing methodology to multifamily and single-family rental listing data and transactional data. The indices are updated monthly and fully revised with each release to signal turning points sooner.
The indices assume 100 on 1st January 2015. This is the base month and year with which the values from other points in time are compared.
Why is it called ‘Recent Movers’ Indices?
A recent mover essentially just represents a new lease in the case of our Recent Movers Indices – we use listings data. By including only new leases and excluding renters renewing, this acts as a timely indicator of the market rate.
Who is Beekin’s Recent Movers Index for?
It is useful for acquisition teams, asset management teams who want to understand real-time market rent changes on an absolute and relative basis. Due to the granularity, depth and statistical rigor underpinning the indices, these indices provide unmatched transparency on market rents for MF and SFR dwellings.
Check also: What Build-to-Rent Can Learn from Multifamily in Revenue Management
How is the index calculated?
The indices are calculated by tracking the rental price movements in repeat rental listings of the same sample over time, deriving from rental data covering over 14 million rental properties. Prices used are the asking rental prices that the properties listed at. We can think of the method in 3 main stages:
- We take rental listing price data for properties across the Contiguous United States starting as early as 1st January 2014.
- We calculate growth curves down to each individual property for single-family, or down to each floorplan type in an apartment block for multifamily (defined by the square foot area, number of bedrooms and number of bathrooms). Properties will, of course, have periods of no listing data lasting for months while they are occupied and not on the market. We interpolate in between the repeat-listing data points to fill the gaps. We do this using logarithmic interpolation, essentially fitting an exponential line through the existing data points for each property. From this, we can calculate the growth rates each month. A data point for a given month is recorded if we have a record of a property listed at least once in any month prior to that month in question, and also listed at least once in any month following the month in question. Only if a property has this data will it contribute to the month’s value.
- We then take an average of the growth rates for the entire sample of properties on a monthly basis. The most recent data points will be the average of growth rates of properties we’ve seen recent data for. Where recent data is missing for a region, the model will interpolate by averaging the last seen growth in that region with the Contiguous US total growth of that month. As soon as we get a new data point for a property, we will include it and retrospectively update previous months’ averages.
- A quarterly-weighted average index is then created, weighted by the number of data points for each month within the quarter for each geographic area.
The method is similar to the CPI (Consumer Price Index) used by the Bureau of Labor Statistics. Here is their methodology for reference.
How does the index adjust for the changing composition of the sample (e.g. as more properties are added to the data source)?
Our index is a repeat-listing index that compares aggregate rent growth at a property (SFR) or property-floorplan (Multifamily) level. We calculate individual growth curves for each property before aggregating. Although this does not eliminate bias due to sample composition, it is significantly less than if we merely aggregated our sample prices, as this would vary quite a lot from sample to sample. As we are aggregating growth curves, and we can interpolate values along this curve, the composition of the sample at each time point is fairly consistent – the only changes are properties we never see again after that time point, or properties that we have never seen until that time point, which is a fairly small subset of properties at any given time point
Furthermore, as our sample is fairly substantial, on the order of magnitude of the population (for the largest MSAs), there is not much room for our sample to deviate from the population due to random sampling error.
Is the index seasonally adjusted?
We do not currently incorporate any seasonal adjustment into the building of the index. We try to keep the index as raw as possible, as our clients will often have their own ideas for how to adjust it for seasonality, or other reasons.
Does the index use weights to adjust for compositional effects?
We currently do not apply weighting our index at all. We try to keep the index as raw as possible, as our clients will often have their own ideas for how to adjust it for seasonality, or other reasons.
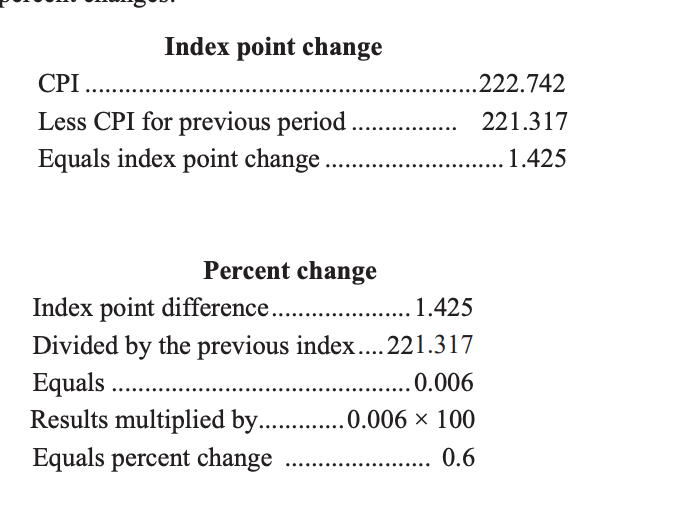
How should I use the index to measure percentage changes in rental prices?
Below is a measurement of CPI and how to convert the index into percentage changes in inflation. We should follow the same method for our rental index.
What is the meaning of the index being a ‘same-store’ index?
This means that for each property that the index is built on, Beekin’s Recent Movers Index tracks the rental price movements of that same property (for SFR) or same unit type within an apartment block (for MF) in repeat listings over time. In this way, like-for-like growths are calculated for each, from which the MSA index values are derived after aggregating growths across all properties in the MSA. A unit type within an apartment block is defined by the square foot area, number of bedrooms and number of bathrooms.
This is different to taking, for example, a median of all rental prices at two different points in time and calculating growth, which would not be controlling for factors such as the number of bedrooms/bathrooms, the property condition. Beekin’s Recent Movers Index aims to account for these factors, by using a ‘same-store’ approach.
What are the drawbacks of the indices?
A couple of drawbacks. One is that improvements/renovations to properties are not necessarily accounted for in the same store. In the hypothetical scenario where a lot of properties in an MSA are renovated and rented again, the rent may be higher. However, if a property has undergone a renovation resulting in a change in the number of bedrooms/bathrooms, this will then be treated as a new property.
The second drawback is sample size. Some months may have no observations. This is natural for winter months where properties may not be leased since people do not move then. This may impact the index values for those months, or make them more volatile (few leases signed above or below trend can skew results).
| https://beekin.co/recent-movers-indices/multifamily-recent-movers-index/delaware | Multifamily Recent Movers Index Delaware |
| https://beekin.co/recent-movers-indices/multifamily-recent-movers-index/georgia/ | Multifamily Recent Movers Index Georgia |
| https://beekin.co/recent-movers-indices/multifamily-recent-movers-index/idaho/ | Multifamily Recent Movers Index Idaho |
| https://beekin.co/recent-movers-indices/multifamily-recent-movers-index/iowa/ | Multifamily Recent Movers Index Iowa |
| https://beekin.co/recent-movers-indices/multifamily-recent-movers-index/new-hampshire/ | Multifamily Recent Movers Index New Hampshire |
| https://beekin.co/recent-movers-indices/multifamily-recent-movers-index/new-york/ | Multifamily Recent Movers Index New York |
| https://beekin.co/recent-movers-indices/multifamily-recent-movers-index/north-carolina/ | Multifamily Recent Movers Index North Carolina |
| https://beekin.co/recent-movers-indices/multifamily-recent-movers-index/south-dakota/ | Multifamily Recent Movers Index South Dakota |
| https://beekin.co/recent-movers-indices/multifamily-recent-movers-index/tennessee/ | Multifamily Recent Movers Index Tennessee |
| https://beekin.co/recent-movers-indices/single-family-recent-movers-index/nevada/ | Single Family Recent Movers Index Nevada |
| https://beekin.co/recent-movers-indices/single-family-recent-movers-index/ohio/ | Single Family Recent Movers Index Ohio |
| https://beekin.co/recent-movers-indices/single-family-recent-movers-index/utah/ | Recent Movers Index Utah |
| https://beekin.co/recent-movers-indices/single-family-recent-movers-index/vermont-single-family-rental-price-index/ | Vermont Single-Family Rental Price Index |
Beekin ®
Applied AI for Rental Housing – Asset Optimization for Efficient Operations, and 50bps higher asset yield
Check also: Arkansas leads the nation with a 10.2% increase in multifamily rental prices