2023 RENTS LAG BEHIND HOME PRICES, CPI AND WAGE GROWTH IN MOST MARKETS
Rental affordability improves as prices rise 0.4% for single family rentals and 1.1% for apartments, while median home prices rise 2.1%, CPI by 4.1% and wages by 4.5%
The rate of annual rental price increases for both single family rental properties and multifamily rental units continued to trail increases in the median home price, the consumer price index (CPI), and wage growth in 2023. While the Consumer Price Index (CPI) rose 4.1% from during 2023, rents on multifamily rental units rose by only 1.1% and by only 0.4% on single family rental properties. Rental price increases also lagged behind wage growth, which increased by 4.5%, and the increase in the median price of homes, which was up 2.1% according to ATTOM’s 2023 Year End Home Sales Report.
Increases in rental prices on single family properties exceeded the growth of the median sales price of homes in only 13 states, while home price increases were higher than rental price increases in 37 states and the District of Colombia. Rent price increases on multi-family units were lower than home price increases in 29 of the 47 states with enough data available to report on.
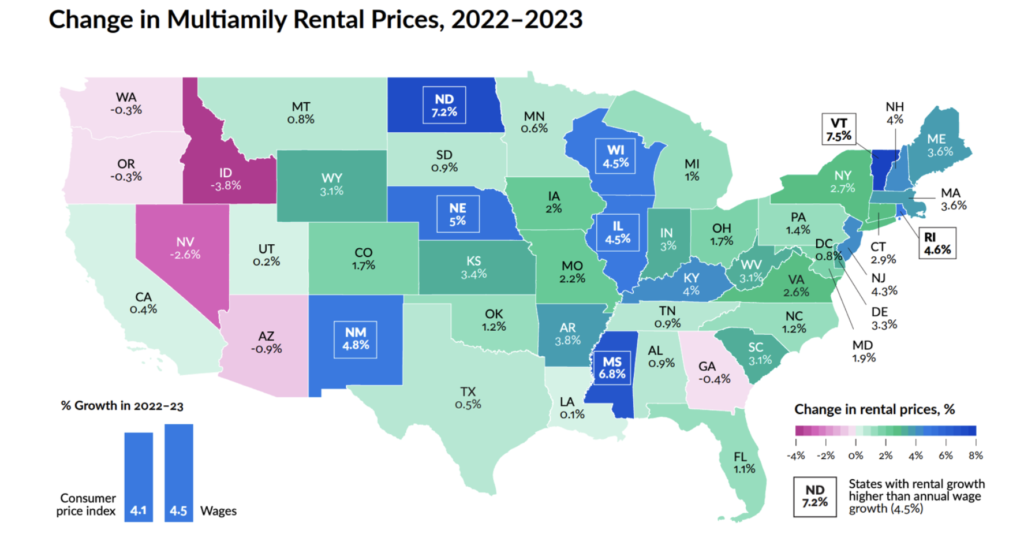
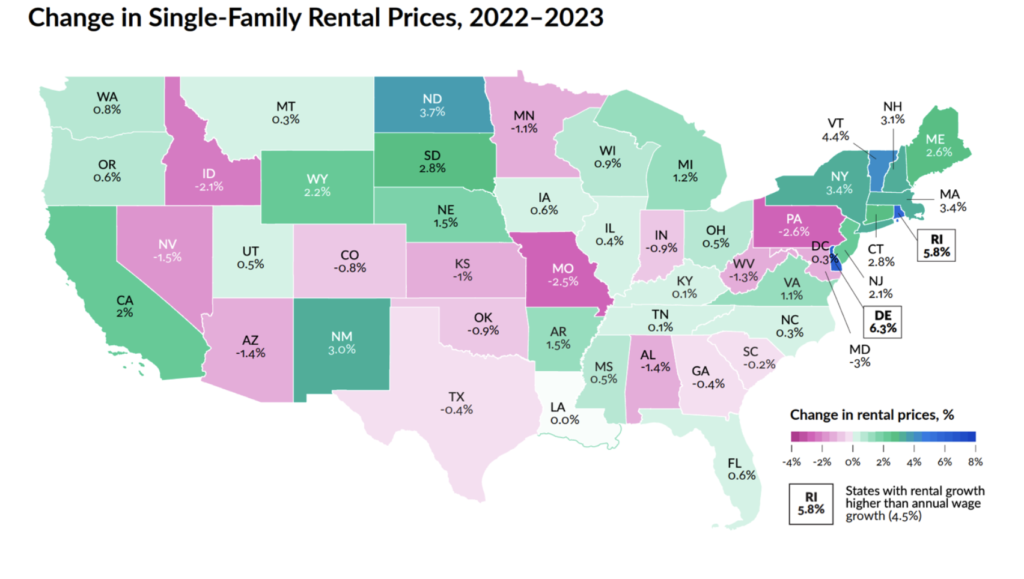
Multifamily and Single-Family Rent Increases Below Wage Growth and CPI in Most States.
The 4.1% CPI growth was higher than rental increases for multifamily units in all but nine states:
Vermont (7.5% rental increase), North Dakota (7.2%), Mississippi (6.8%), Nebraska (5%), New Mexico (4.8%), Rhode Island (4.6%), Wisconsin and Illinois (4.5%), and New Jersey (4.3%). Similarly, only six states – Vermont, North Dakota, Mississippi, Nebraska, New Mexico, and Rhode Island – had rental growth higher than the 4.5% annual wage growth in 2023.
The difference was even more stark when measuring rental price increases in the single-family rental market, where only two states had higher rate increases than wage growth – Delaware at 6.3%, and Rhode Island at 5.8% – and one more state, Vermont at 4.4% had rental increases higher than the 4.1% CPI increase. According to Beekin’s data, 16 states experienced negative year-over-year rental prices in the single-family market, while 6 states had negative growth in multifamily rents.
Housing Costs Rise Faster Than Rents in Most MSAs Across the Country in 2023.
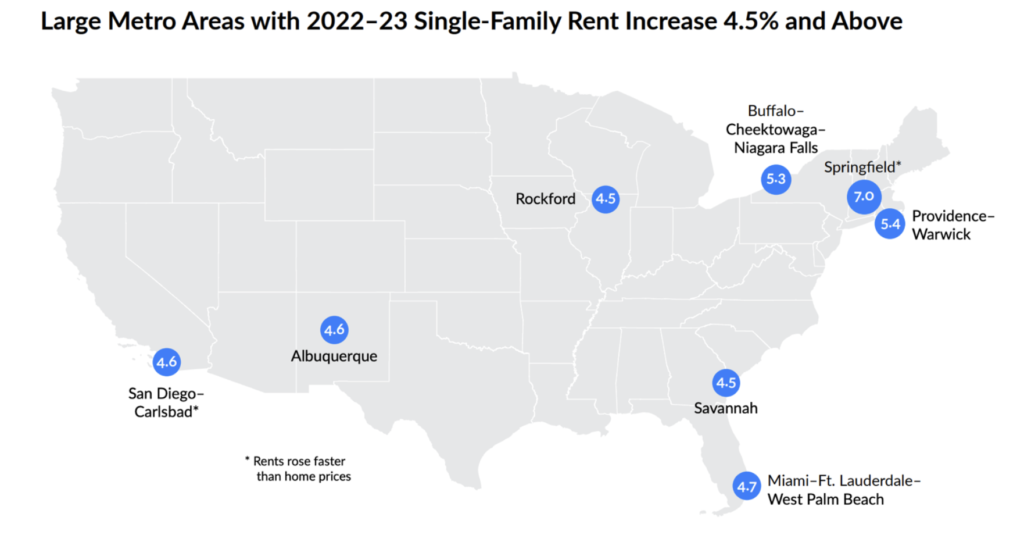
Median home prices as reported by ATTOM in its year-end report rose faster than single-family rents in 80 of the 116 largest MSAs across the country in 2023. In fact, only 11 MSAs had single-family rent increases above 4%: Springfield, MA (7%); Providence/Warwick, RI-MA (5.4%); Buffalo-Cheektowaga-Niagara Falls, NY (5.3%); Miami-Ft. Lauderdale-West Palm Beach, FL (4.7%); San Diego-Carlsbad, CA and Albuquerque, NM (4.6%); Savannah, GA and Rockford, IL (4.5%); Knoxville, TN (4.3%); Naples-Immokalee-Marco Island, FL (4.2%); and York-Hanover, PA (4.1%). Only two of those markets saw rents rise faster than home prices – Springfield and San Diego-Carlsbad.
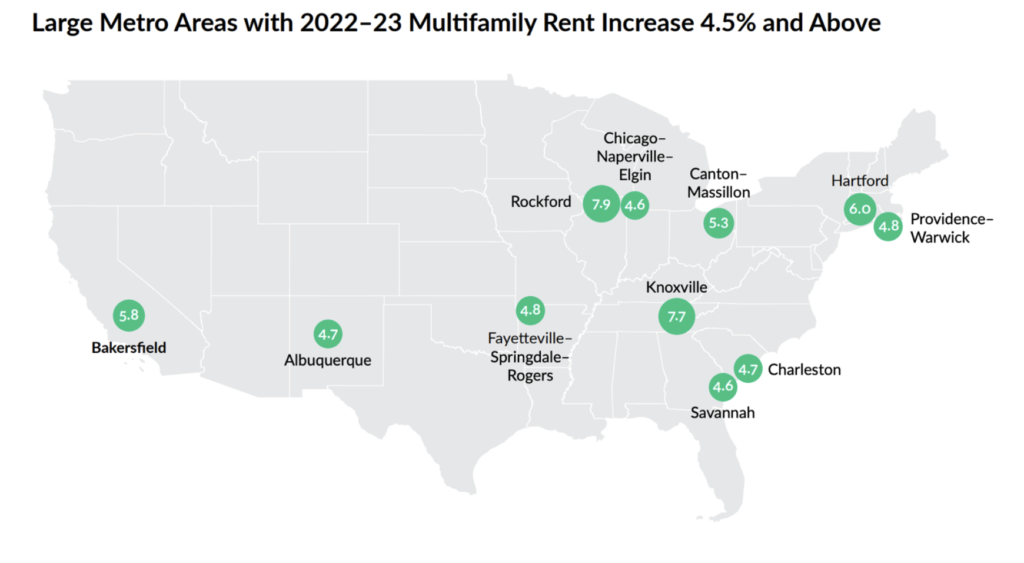
Similarly, home prices rose more than multifamily rents in 69 of the 116 markets covered. In the multifamily sector, only 11 MSAs had property increases of 4.5% or more: Rockford, IL (7.9%); Knoxville, TN (7.7%); Hartford-West Hartford-East Hartford, CT (6%); Bakersfield, CA (5.8%); Canton-Massillon, OH (5.3%); Fayetteville-Springdale-Rogers, AR-MO and Providence-Warwick, RI-MA (4.8%); Charleston-North Charleston, SC and Albuquerque, NM (4.7%); and Chicago-Naperville-Elgin, IL-IN-WI and Savannah, GA (4.6%).
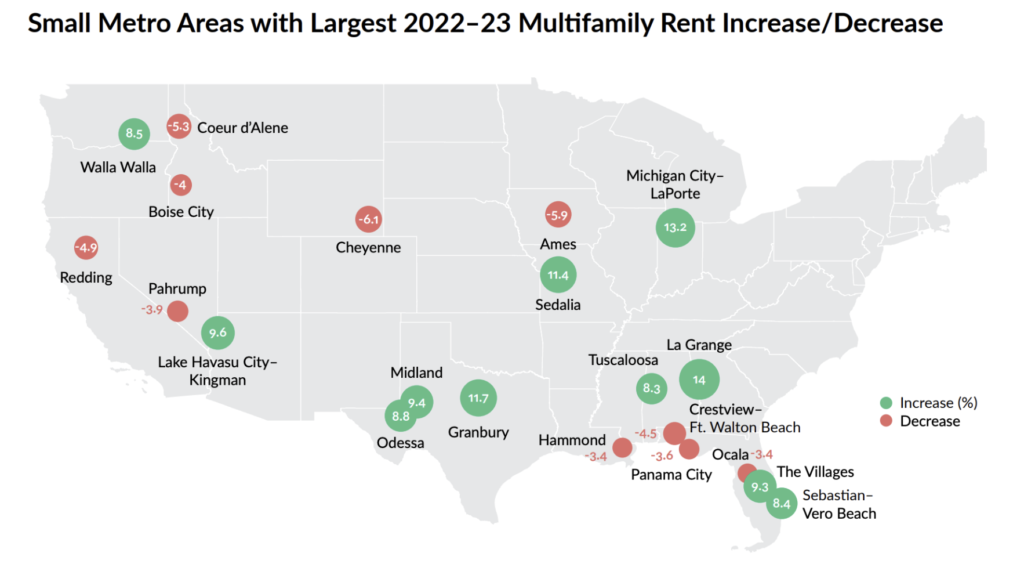
Multifamily Rental Growth Uneven Across the Country.
Of the 248 MSAs measured by Beekin in this report, 48 experienced negative multifamily rent growth for the year, with Cheyenne, WY having the biggest drop at -6.1%. Cheyenne was followed by Ames, IA (-5.9%); Coeur d’Alene, ID (-5.3%); Redding, CA (-4.9%); Crestview-Ft. Walton Beach, FL (-4.5%); Boise City, ID (-4.0%); Pahrump, NV (-3.9%); Panama City, FL (-3.6%); and Ocala, FL and Hammond, LA (-3.4%).
At the other end of the spectrum, LaGrange, GA-AL had the largest annual increase in
multifamily rental prices at 14%, followed by Michigan City-LaPorte, IN (13.2%); Granbury, TX (11.7%); Sedalia, MO (11.4%); Lake Havasu City-Kingman, AZ (9.6%); Midland, TX (9.4%); The Villages, FL (9.3%); Odessa, TX (8.8%); Walla Walla, WA (8.5%); Sebastian-Vero Beach, FL (8.4%): and Tuscaloosa, AL (8.3%).
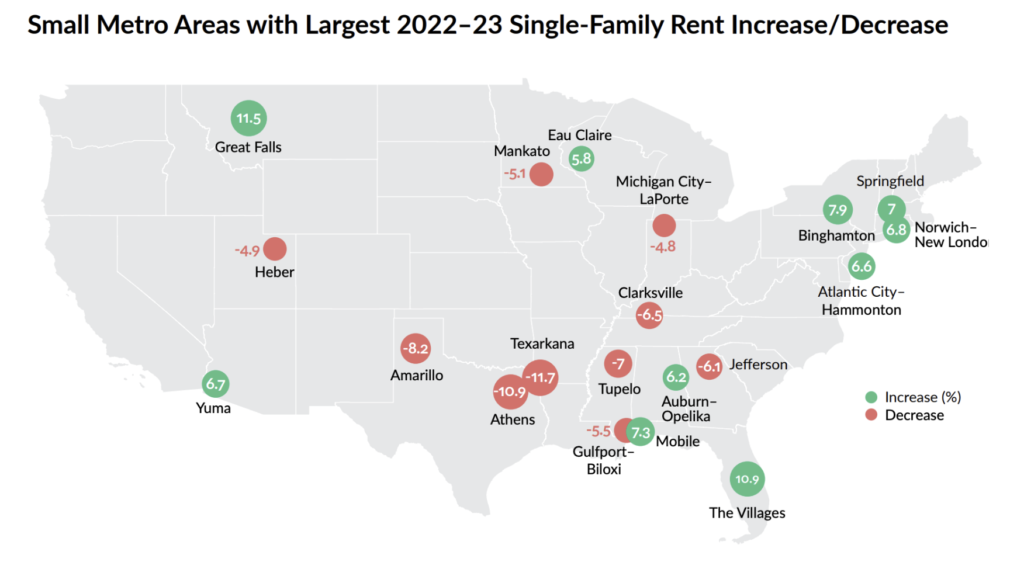
Single-Family Rental Rates Show More Volatility.
There was nearly a 23-point swing between the MSA with the highest single-family rental rate increase in 2023 (Great Falls, MT at 11.5%) and the MSA with the largest rental rate decline (Texarkana, TX-AR at -11.7%). Almost twice as many single-family rental markets had negative annual rental prices (93) as negative multifamily markets. After Texarkana, the markets with the largest declines were Athens, TX (-10.9%); Amarillo, TX (-8.2%); Tupelo, MS (-7%); Clarksville TN-KY (-6.5%); Jefferson, GA (-6.1%); Gulfport-Biloxi, MS (-5.5%); Mankato, MN (-5.1%); Heber, UT (-4.9%); and Michigan City-LaPorte, IN (-4.8%). Ironically, at the same time, Michigan City-LaPorte had one of the highest increases in multifamily rents, as noted above.
After Great Falls, the other MSAs with the 10 highest single-family rental rate increases in 2023 were The Villages, FL (10.9%) where multifamily rents also climbed; Binghamton, NY (7.9%); Mobile, AL (7.3%); Springfield, MA (7%); Norwich-New London, CT (6.8%); Yuma, AZ (6.7%); Atlantic City-Hammonton, NJ (6.6%); Auburn-Opelika, AL (6.2%); and Eau Claire, WI (5.8%).
The slowing of rental price increases is good news for the millions of prospective homebuyers who have been priced out of the market by the combination of high home prices and higher mortgage rates With rental rates rising more slowly than wages for the first time in several years, and a massive amount of new rental inventory coming to market, tenants are in better shape today than they’ve been in quite some time.
Methodology
Beekin used same-store data on more than 12MM unique single-family homes and multifamily units, beginning in 2015. Using interpolation methods similar to those used by the Bureau of Labor Statistics for the Consumer Price Index, it was able to infer rent growth at a national, state and local level for over 170 MSAs across the country. Wage data is sourced from the Bureau of Labor Statistics report on average hourly earnings of non-farm employees. State and MSA-level data available upon request.
About Beekin
Beekin is a Decision Intelligence platform for rental housing. By leveraging cutting edge AI and data, Beekin’s patented solution suites help with underwriting, asset management, and capital markets for some of the largest lenders and asset managers. For more information, please visit Beekin.co.