Colorado and 4 secondary cities
Multifamily operators in secondary cities face several financing challenges compared to their counterparts in primary markets. Some key pain areas
- Higher lending requirements – Lenders typically demand higher debt service coverage ratios, lower loan-to-value ratios, and more substantial reserves for properties in secondary markets.
- Limited lender options – Fewer regional and national lenders actively finance deals in secondary markets, resulting in less competition and potentially less favorable terms.
- Risk perception premiums – Capital providers often charge higher interest rates to compensate for the perceived additional risk of secondary markets.
- Market volatility sensitivity – Secondary markets can experience more dramatic swings in occupancy and rental rates during economic downturns.
- Economic base concerns – Lenders worry about markets dependent on a limited number of employers or industries.
Using data from Beekin same-store rental indices, we analyze secondary cities around the country and compare them to the primary MSAs in the state. This helps understand multifamily investment opportunities in these cities and the volatility inherent in these markets.
Colorado:
Coloardo as a market has seen steady rent increases, leading upto COVID-19, which saw a higher than normal rent spike. Subsequently, due to new supply and tepid demand, rents have softened and same-store rent growth has dropped to negative territory in 2025, with March 2025 showing a negative 0.1% growth compared to the same period last year. A large part of Colorado multifamily is concentrated in the Denver MSA and hence the state is heavily influenced by the vagaries of the Denver market.

With a population of 3 million, Denver (Denver-Aurora-Lakewood MSA in our analysis) stands out as the business destination for multiple commercial real estate investors. The city has seen significant investment from institutional real estate investors into multifamily over the past 5 years.

However, there are a few secondary cities which continue to be attractive to migrants and knowledge workers such as:
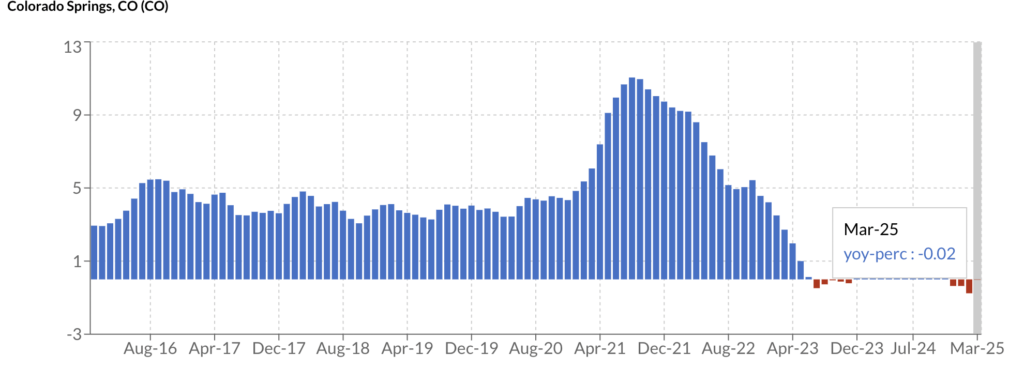
- Colorado Springs – Military presence, growing tech sector, more affordable than Denver
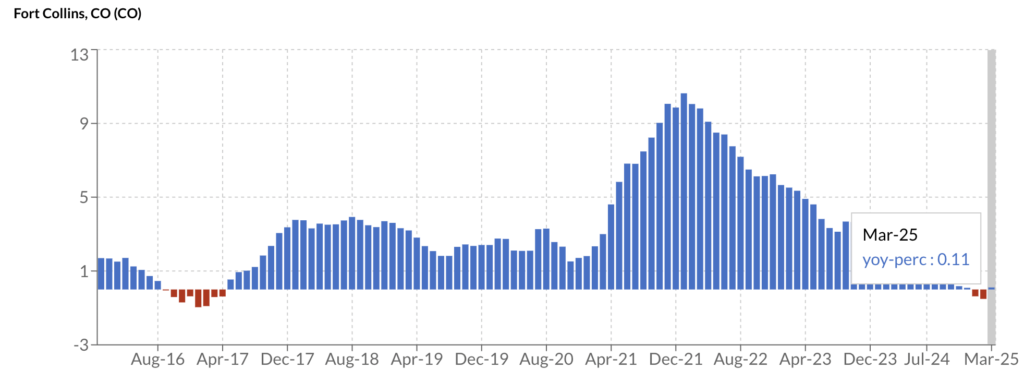
- Fort Collins – University town with strong job growth and quality of life
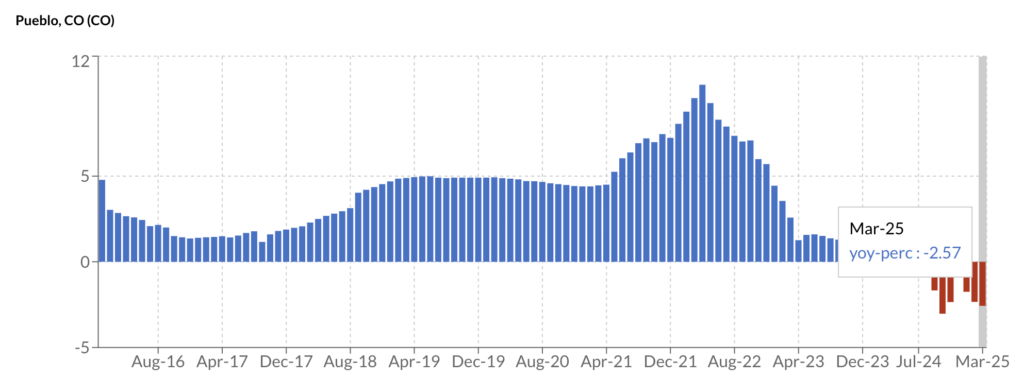
- Pueblo – Emerging manufacturing hub with increasing investment
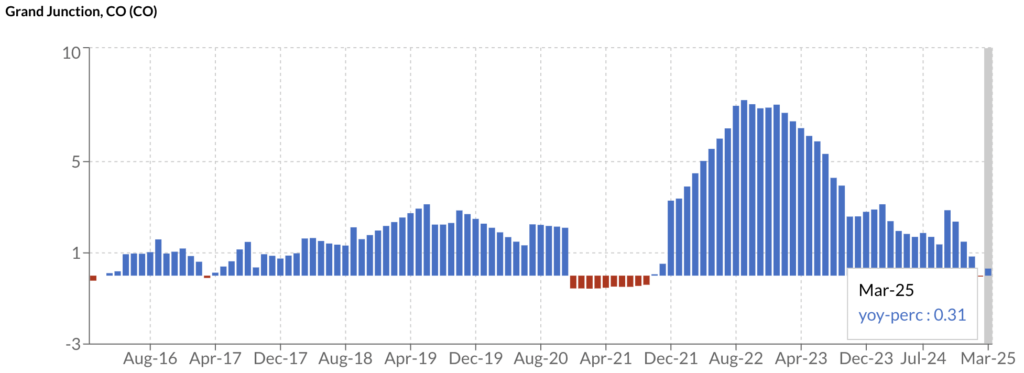
- Grand Junction – Energy sector and outdoor recreation economy
Let’s analyze how these cities and their apartment rental market has fared over the past 10 years.
10 year analysis Secondary MSAs Vs. Denver MSA
| MSA | % 10 year Rent Change | Peak Rent Index | Peak Rent Period | Standard Deviation | Volatility Score | Max-Min Range |
| Denver-Aurora-Lakewood | 31% | 1.35 | (Jun-Jul 2024) | 12% | 10% | 35% |
| Colorado Springs | 45% | 1.48 | (Jul-Aug 2024) | 17% | 13% | 48% |
| Grand Junction | 21% | 1.22 | (Jul-Dec 2024) | 7% | 7% | 23% |
| Pueblo | 40% | 1.43 | (Multiple in 2023-24) | 15% | 12% | 43% |
| Fort Collins | 36% | 1.41 | (Jul 2024) | 14% | 12% | 41% |
As we can see, rent values peak around July all the way to December in 2024 and have come down significantly since. This is owing to inflation and consumer confidence.
 |  |
 |  |
Where is the market more volatile for rents
1. Growth vs. Volatility Correlation: The markets with the highest overall growth (Colorado Springs and Pueblo) also exhibited the highest volatility, suggesting that stronger appreciation comes with higher price fluctuations.
2. Grand Junction: stands out as having both the lowest growth and lowest volatility, indicating a stable but slower-growing rental market.
3. Volatility
– Colorado Springs and Pueblo experienced more pronounced fluctuations, especially during 2021-2023
– Denver showed more moderate, consistent growth with fewer sharp movements
– Fort Collins exhibited periodic volatility with distinct growth phases
– Grand Junction maintained the steadiest trajectory with minimal fluctuations
4. Market stability using 10 year data
– Grand Junction offers the most stable rental price environment, indicating a market in balance
– Colorado Springs represents the least predictable market with larger price swings
– Denver, despite its size, saw reasonable stability considering its growth
This volatility analysis complements the growth analysis by showing that not only did different Colorado MSAs experience varying levels of rental price growth, but they also followed different patterns of stability in reaching their current levels.
See you in the next state. Watch this space